Equip your organization with essential strategies to enhance data quality and drive impactful finance decisions.
- Gartner client? Log in for personalized search results.
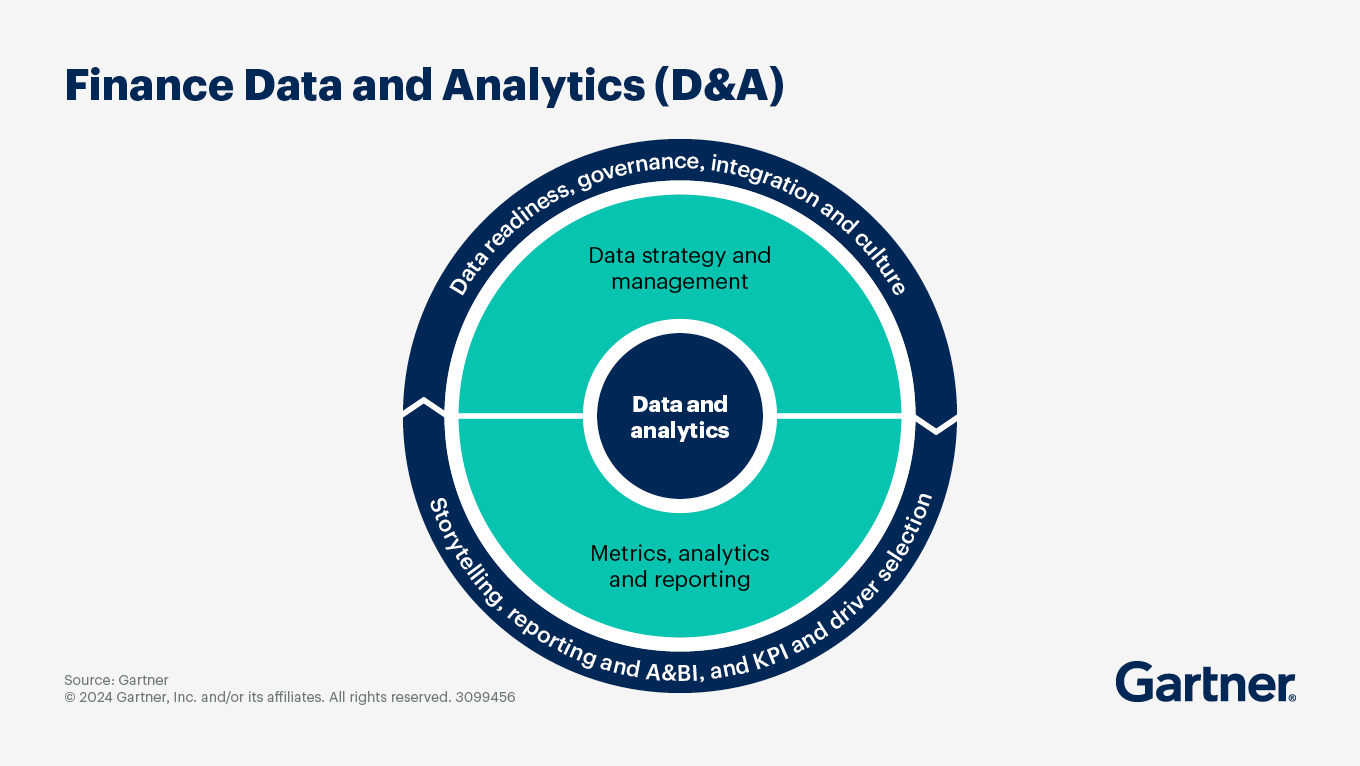
Finance Analytics: Mature Data Management and Reporting Capabilities

Prioritize finance analytics governance for better business outcomes
Over one-third of CFOs believe that data quality inhibits the use of AI in finance. The most effective CFOs build trust in AI by actively prioritizing data and analytics (D&A) governance.
Download “3 Fundamentals of Effective Data and Analytics Governance for CFOs” to learn:
How CFOs can champion enterprise data governance
How you can streamline governance initiatives for optimum efficiency
What top CFOs do differently to tap data’s full potential
Evaluate your financial analytics strategy
To stay competitive and relevant, CFOs and finance leaders must build a robust AI strategy, attract the right talent and fuel financial performance.
Metrics and Storytelling
Finance Reporting
Advanced Analytics
D&A Governance
Boost D&A impact by mapping finance analytics investments to business outcomes
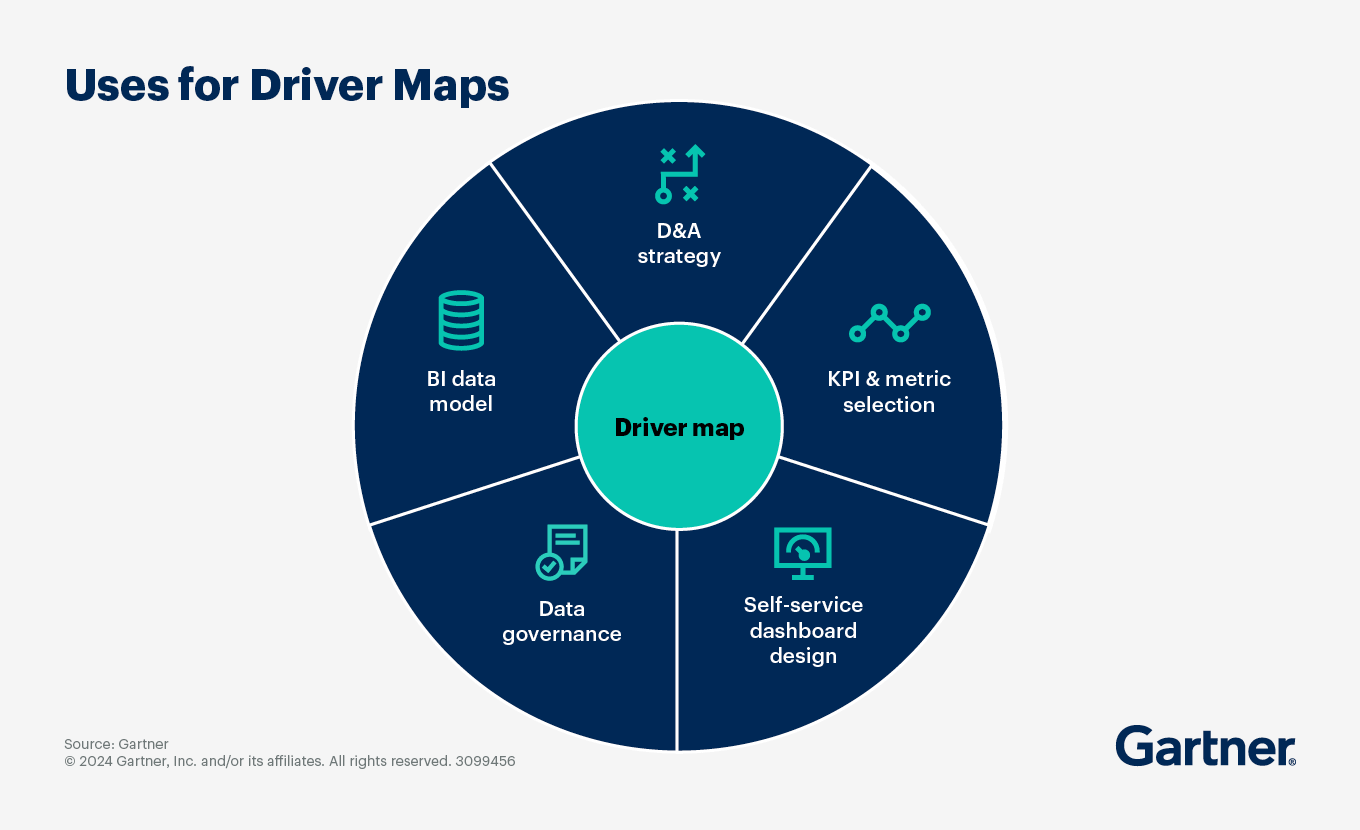
Delivering new, digital finance analytics capabilities requires a clear way to align data and analytics (D&A) investments with business outcomes. Driver mapping can fulfill this need by mapping financial planning and analysis (FP&A) activities to decision makers’ information needs.
Driver maps serve a wide range of organization types, from complex enterprises, government and not-for-profit organizations, to business units, operating regions, product lines and projects.
Driver maps serve multiple purposes, including:
D&A strategy. A driver map visualizes the ways your business creates and delivers financial or strategic value, identifying high-value analytics projects that should be prioritized in your finance analytics strategy. Some teams have used driver maps to source feedback on analytics model design or to educate business leaders to make more financially informed decisions.
KPI and metric selection. Though every KPI is a metric, not every metric is a KPI. Use your team’s strategic fluency and familiarity with currently reported metrics to develop a working draft of KPIs, and share it with outcome owners and decision makers. This approach eases the challenges of engaging leaders as co-creators in the process and minimizes the risk of having too many metrics.
The realities of the data provisioning process should also influence metric selection. Driver mapping helps by separating the conversation of “what needs to be measured” from “how that should be measured.” This allows the inclusion of KPIs and metrics that involve factors beyond relevance alone, such as data quality, latency, effort and timing.

Self-service dashboard design. Intuitive dashboards are essential to self-service reporting — and a driver map provides the outline. Each strategic or operational driver can map to a tab in a self-service workbook, with contextualizing data displayed on-page. The map defines the drill-down and click-through relationships that need to be established in the dashboard, which can save reporting teams months of iteration and rework.
Conceptual data modeling. A driver map is an exercise in mapping data relationships and the data sources needed to produce reports or analyses. In the hands of IT partners, a driver map is a blueprint for data models that are easy to use for analysts and report creators. The driver map can also help keep data lineages organized and well governed.
Data governance. A driver map offers a means to scope and prioritize business value outcomes, decision models, D&A processes and data assets in need of data quality improvements. This perspective improves your team’s ability to explain to business leaders how governance activities will affect operations.
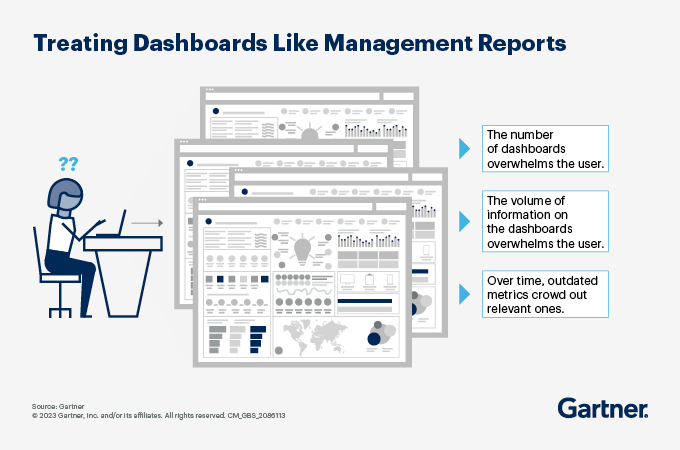
Rethink dashboard design to create a high-value finance analytics reporting experience
Dashboards often don’t deliver on their promise of communicating insights concisely and quickly to support business decision making. Senior finance leaders recognize that current dashboards for financial analytics do not support better decision making. When dashboards fail to reach their full potential, it is because they are bloated, hard to navigate and overwhelm users with information. For effective design of dashboards, finance leaders should follow three key principles:
Differentiate dashboard capabilities and use cases from traditional management reporting.
A dashboard visually tracks, analyzes and displays key performance indicators (KPIs), metrics and key data points to monitor the health of a business, department or process.
Dashboards are different from traditional management reports as they are frequently updated, serve a broader audience on specific situations and allow user engagement with data. FP&A leaders should supplement these distinctions with concrete guidance to their analysts for determining when to use dashboards and when to use management reports. Screening criteria could include situations such as: analysis performed in response to a one-time request (management report), or time-sensitive data that requires frequent updating (dashboard).

Design dashboards as solutions to business problems.
Analysts should use dashboard requests as opportunities to dig deeper into the business problem decision makers are hoping to address. To understand decision makers’ thought processes behind the information requests, analysts can engage them at the time of their request or set up extra time to interview them. During these interviews, analysts should use probing questions to surface drivers and subdrivers of the problem decision makers are looking into.
Share practices to maintain dashboard relevance.
Dashboards tend to accumulate information because new metrics get added and existing, obsolete ones remain. That’s why FP&A leaders should share practices with analysts that prevent information overload and maintain dashboard relevance for decision makers. To achieve this, guide analysts on how to retire underutilized metrics and track dashboard usage.
Understand the use cases for predictive and prescriptive financial analytics
Increasing data volumes, business complexities and growing uncertainties require a quick shift from manual to advanced and augmented analytics. This means carefully designing processes to fully leverage digital capabilities and safeguard the integrity and quality of machine outputs.
Predictive and prescriptive analytics are key to this evolution. These AI- and ML-based analytics are growing areas of investment in finance. Each requires different levels of technical sophistication, staff skills, organizational structures and FP&A maturity.
AI- and ML-driven advancements take finance analytics to the next level.
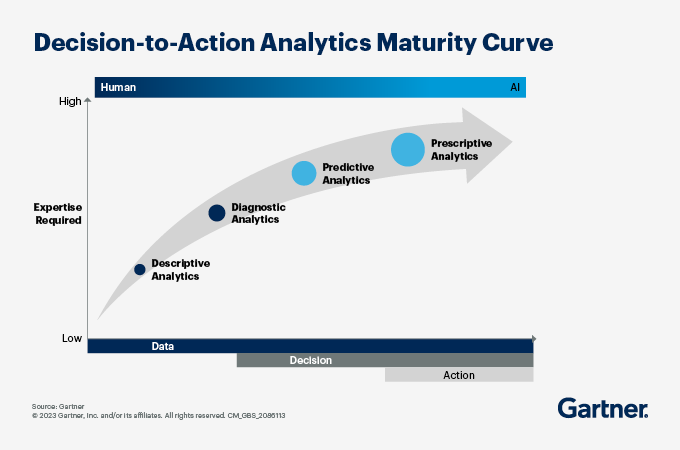
There are four major categories of advanced finance analytics:
Descriptive analytics reports on overall and departmental performance by answering, "What happened?" It analyzes historical financial data to uncover trends and insights, helping organizations understand past performance, monitor financial health, and make informed decisions.
Diagnostic analytics is a form of advanced analytics that examines data or content to answer the question: Why did it happen? It is characterized by techniques such as drill-down, data discovery, data mining and correlations.
Predictive analytics is a form of advanced analytics that examines data or content to answer the question: What will happen or, more precisely, what is likely to happen? It is characterized by techniques such as regression analysis, forecasting, multivariate statistics, pattern matching and predictive modeling. Predictive analytics has already been deployed in most organizations and can be executed by existing staff with existing technology.
Prescriptive analytics is a form of advanced analytics that examines data or content to answer the question: What should be done, or what can we do to make x happen? It is characterized by techniques such as graph analysis, simulation, complex event processing, neural networks, recommendation engines, heuristics and machine learning. To deploy, prescriptive analytics typically requires additional resources, including staff, technical training and new technology investments.

As you build a strategy to leverage the capabilities offered by advanced analytics technologies, consider the following questions:
- What finance analytics capabilities should we be investing in?
- How do we develop an AI strategy in finance?
- What are the best use cases for AI in finance?
- How should we leverage AI/ML to deliver advanced and predictive analytics?
- How should we evaluate and quantify ROI for our finance analytics initiatives?
The role of AI technology in D&A governance for finance analytics
By 2028, 60% of financial planning and analysis (FP&A) leaders will use AI technologies to govern data and analytics (D&A). However, assessing the value of D&A governance technologies is challenging due to the emergence of new AI use cases and technologies themselves. Differentiating between hype and real value is essential. Some technologies offer innovation but are still in early stages, while others have matured for mainstream use.
D&A governance innovations empower FP&A leaders to achieve four key objectives:
Enhance data integrity and quality. AI excels by leveraging high-quality data and helping FP&A leaders and their teams address issues such as data inaccuracies, inconsistencies and duplications. Solutions that incorporate capabilities like anomaly detection, DataOps or data observability help FP&A leaders ensure uniformity, accuracy and integrity of the enterprise’s data, facilitating data democratization.
Drive unbiased decision making with AI and proactive D&A governance. AI helps FP&A leaders with unbiased decision making by automating knowledge-based tasks while also transforming the role of humans to validate automated decisions, thus minimizing the risk of bias. Technological solutions like explainable AI and semantic search help FP&A leaders add context and reduce bias by providing decision makers with visibility into data sources, algorithms and models used for insights. New and more proactive D&A governance frameworks and policies are needed to ensure data is ready for AI applications.
Ensure ethical AI development and operations. As AI becomes mission-critical in the enterprise, FP&A leaders are challenged to govern AI effectively and ensure it is used ethically. Technologies like AI governance and responsible AI help FP&A leaders ensure accountability at all levels of the organization for risks and investment decisions associated with the application and ethical use of AI solutions.
Foster a data-first mindset and develop digital skills. D&A governance enables organizations to promote a data-driven culture and enhance digital skills among employees. By establishing clear roles, responsibilities and processes, D&A governance practices foster a mindset of using data for decision making. Collaboration with AI experts facilitates the creation of unbiased, cross-functional, data-driven solutions. Investing in technology that supports a data-driven culture is crucial. Data literacy assessments and stewardship programs bridge skills-technology gaps to ensure high-quality D&A availability, minimize risks and maintain business partners’ trust.
Attend a conference
Experience Gartner for yourself
Gather alongside your peers in National Harbor to gain insight on emerging trends, receive one-on-one guidance from a Gartner expert and create a strategy to tackle your priorities head-on.
27 – 29 May 2026
Gartner Finance Symposium/Xpo™
National Harbor, MD

Related finance analytics resources
Gartner clients: Log in for a complete suite of actionable insights and tools on finance analytics.
FAQ on finance analytics
What is finance analytics?
Finance analytics involves the application of data analysis, statistical models and machine learning to financial data to derive actionable insights. This field covers areas such as risk management, forecasting, budgeting and performance evaluation. By converting raw data into strategic intelligence, finance analytics helps optimize investment decisions, reduce costs and enhance overall profitability, thereby supporting more informed and effective financial decision making.
Why is finance analytics important?
Finance analytics is essential for informed decision making, risk management and strategic planning. It enables organizations to forecast financial trends, optimize budgets and improve investment strategies. By analyzing historical data and identifying patterns, finance analytics helps mitigate risks and enhance profitability. Additionally, it supports regulatory compliance and operational efficiency, ensuring that financial operations align with organizational goals and market conditions.
What are the benefits of using finance analytics?
Finance analytics improves the business’s understanding of performance drivers, opportunities, risks and course corrections. Doing so is key to improving the financial soundness of business decisions and achieving finance’s objective of being a trusted advisor to the business.
What is the future of finance analytics?
Finance leaders have a unified vision for a digital-by-default finance function with a highly scalable structure, finance data available on demand and a high concentration of digital and decision support skills. But only 23% of finance leaders are satisfied with progress on current initiatives related to real-time commercial analytics.
Realizing the future of digital finance analytics will require forward-looking transformation actions that will allow finance to maximize the unique value it can offer the organization.
Drive stronger performance on your mission-critical priorities.