Comparative performance metrics can illuminate a sales team’s strengths and weaknesses — and help chief sales officers understand why top performers win.
- Gartner client? Log in for personalized search results.

Sales performance metrics are a guiding light for CSOs
Too often, chief sales officers (CSOs) and other sales leaders rely on intuition or disconnected lagging indicators to evaluate team productivity. Moreso, typical seller productivity metrics tell a limited story — and fail to reveal which success factors really drive individual performance.
To improve the performance of key seller roles, including sales development representatives (SDRs), account executives (AEs) and key account managers, CSOs require role-specific sales performance metrics and comparative analytics to evaluate the team’s performance, provide targeted coaching and make strategic investments.
Indexing sales performance metrics unlocks new insights
A comparative seller performance index (CSPI) is your guiding principle for data-driven evaluation. This metric is calculated as individual performance minus peer performance, divided by peer performance — a formula that considers how an individual’s performance compares to one’s peers and how that individual’s performance affects their overall productivity. It is an intuitive gauge of strengths and weaknesses in the activities that directly lead to commercial success. Indexing performance metrics also allows meaningful comparison among different metrics, which uncovers insights that are otherwise lost.
Customize sales performance metrics by role
There’s no universal measure of productivity among organizations and sales teams. Since responsibilities are specialized for each sales role, the definition of productivity must be tailored to match.
For example, SDR productivity is best judged with lead generation metrics, including calls per time period, calls that generate leads, and average lead values. AE productivity is concentrated on revenue production and pipeline progression.
Pinpoint the qualities of your top performers
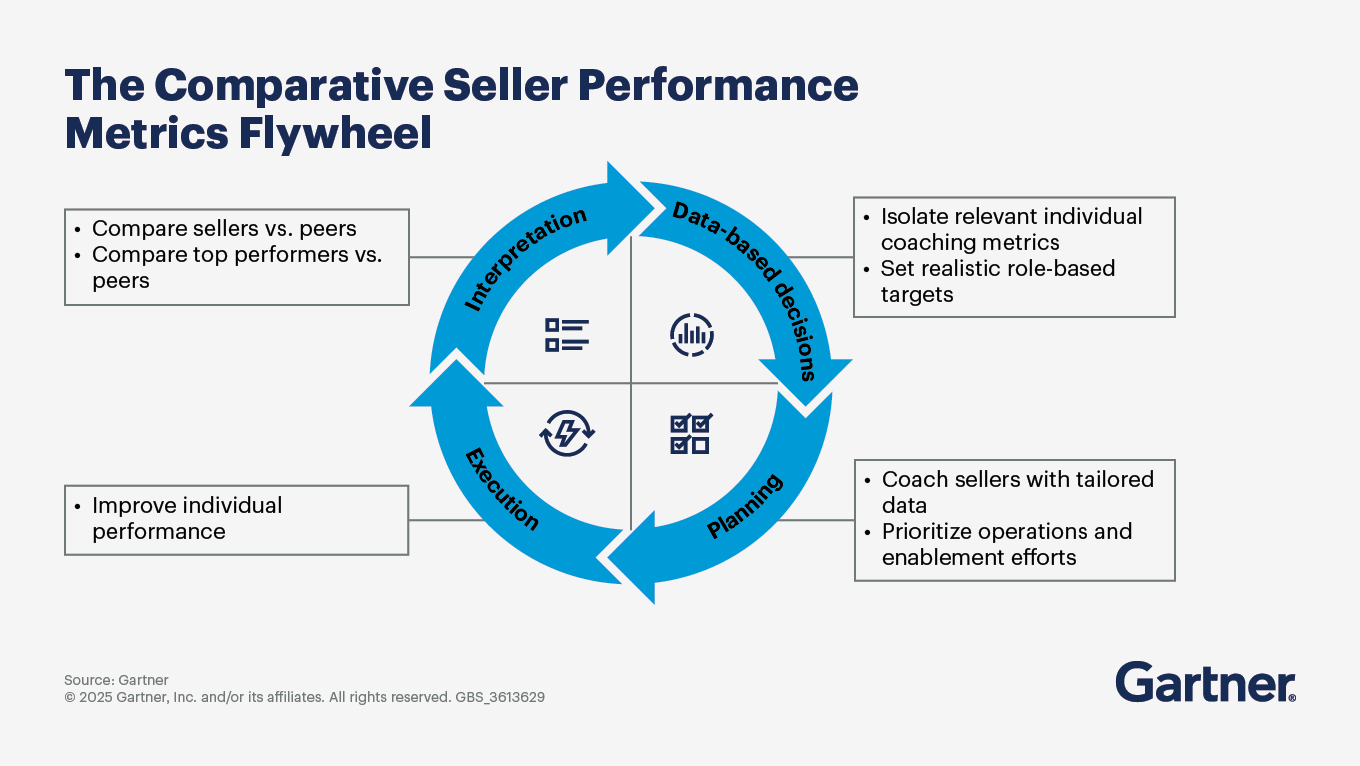
Identify top performers based on appropriate sales performance metrics, and compare CSPI results to the peer baseline. Use that information to answer these questions:
Which activities make the biggest contribution to success in each sales role?
How can I provide that information in a way that motivates seller behavior?
What enablement and operations efforts will foster and incentivize appropriate activities?
But be forewarned: The validity of CSPI analyses is directly dependent on validity of peer cohort definitions, consistent opportunity management processes, and sample size.
Use CSPI to guide investments
Based on top performers’ CSPI results, sales leaders can objectively determine how to prioritize sales enablement and sales operations efforts.
For example, if top performers excel in pipeline creation, consider investing in lead-routing technology and offering training on early-stage qualification activities. If average deal size is where high performers shine, think about creating cross-sell/upsell training and collateral and conducting territory planning.
Sales performance metrics FAQs
What is a sales performance metric?
A sales performance metric is a measurable indicator used to assess the success of sales efforts and strategies. These metrics enable CSOs to pinpoint success factors and refine coaching by benchmarking seller performance against peers, thereby boosting overall productivity.
What are the most important sales performance metrics to track?
Key sales performance metrics vary by role. Track sales development managers on lead generation quality and quantity. For AEs, focus on revenue production and pipeline progression. Gartner research offers insight into further sales performance metrics for individual roles.
Attend a Conference
Join Gartner experts and your peers to accelerate growth
Gather alongside your peers in Las Vegas to gain insight on emerging trends, receive one-on-one guidance from a Gartner expert and create a strategy to tackle your priorities head-on.
19 – 20 May 2026
Gartner CSO & Sales Leader Conference
Las Vegas, NV

Drive stronger performance on your mission-critical priorities.